Family Offices in the United States: About 3,000 and Rising
Recent estimates put family offices in the United States near 3,000, but the total shifts by year, source, and whether multi-family firms are included.
How many family offices are there in the US?
About 3,000 is the strongest working estimate for U.S. single-family offices, but it is an estimate rather than a census. The total shifts depending on scope, especially if counts mix single-family and multi-family firms or use North America figures instead of a United States-only baseline.
01How Many Family Offices Are There in the US? the Most Defensible Working Estimate
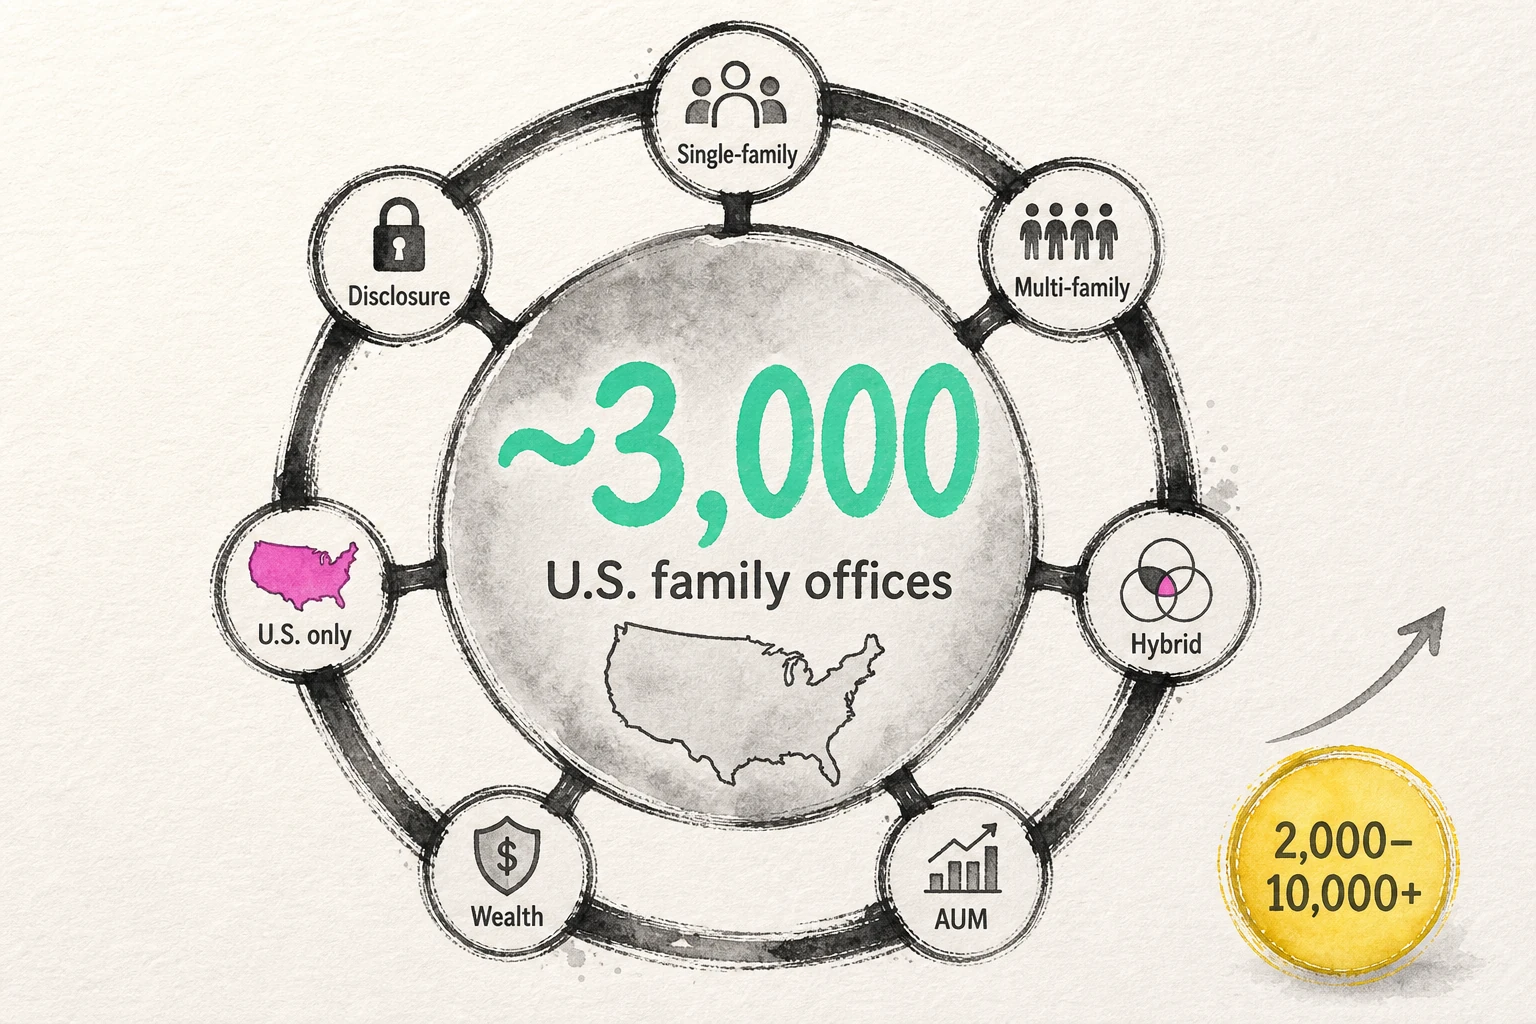
About 3,000 is the strongest working estimate for U.S. single-family offices. Capgemini anchors it, and the scope matters: a U.S.-only single-family-office estimate, not a census of all family offices or office-like structures.
The Best Current Estimate Is About 3,000 U.S. Family Offices, Depending on Scope
Capgemini provides the cleanest baseline for US family offices: about 3,000 U.S. single-family offices, used as a working estimate rather than a census.
Key Findings on What the Family Office Count Includes, Excludes, and Why That Matters
The number only helps if the boundary holds. These key findings keep the estimate usable instead of letting adjacent categories inflate the market on paper.
- Keep SFOs and MFOs separate. Capgemini's baseline is about 3,000 U.S. single-family offices, while about 150 U.S. multi-family offices sit beside that count rather than inside it.
- Keep the geography clean. Deloitte's 3,180 figure covers North America, not just the United States, so it is a caution example rather than a replacement baseline.
- Treat 3,500 as a contextual cross-check, not the main number. CRS cites 3,500 family offices in the United States as of 2020, but the note does not clearly distinguish SFOs from MFOs.
- Read the total as an estimate, not census. Private ownership and patchy disclosure mean no official registry captures every office or related entities consistently.
- Use the count to understand market size, not to infer precision about any single office. The next question is why a market this visible still resists one official total.
02Why the U.S. Family Office Landscape Has No Single Official Count
The missing piece is not better arithmetic. It is the absence of a shared system for deciding what belongs in the family office landscape before anyone starts to count. Once we shift from asking for one final number to asking how an office qualifies, why thresholds move, and what remains visible in private markets, the lack of an official count makes sense.
- Qualification criteria vary. One researcher may count a dedicated office that coordinates broad family needs, while another may exclude lighter arrangements that look closer to wealth management.
- AUM threshold sensitivity changes the pool. Raise the asset cutoff, and fewer families qualify; lower it, and more borderline office structures enter the count.
- Patchy disclosure keeps the universe incomplete. Many entities operate privately, so even a careful observer cannot see every office through one public reporting standard.
What Qualifies as a Family Office Depends on Structure, Services, and Scale
A family office is usually defined less by prestige than by operating depth. The real question is whether an office exists as a dedicated structure for coordinating a family's financial affairs across investments, entities, reporting, and related decisions, or whether the family is still using a lighter outside-adviser model. That remains true whether someone is describing an in-house setup or pointing to formal platforms such as Apollo Global Management or Mousse Investments. That is why two honest counts can disagree before they ever reach a spreadsheet.
- Structure: A true office typically has a distinct operating setup, whether built for one family or organized through a formal platform, rather than a loose collection of providers.
- Services: The work usually extends beyond portfolio selection into coordination of broader financial affairs, which can include administration, governance support, and oversight that standard wealth management may not provide.
- Scale: Wealth still matters because it determines whether families need enough complexity, control, and staffing to justify an office instead of a simpler advisory arrangement.
- Boundary Line: That is the defining feature. A family with significant wealth can still rely on traditional wealth management, while a more institutional setup begins to look and function like an office.
Minimum AUM Thresholds Change Who Gets Counted
Here the counting problem becomes tangible. An AUM or net worth cutoff does not just tidy the dataset. It changes which wealthy families are treated as plausible candidates for an office in the first place.
Take a simple illustrative example. Imagine one researcher counts only families above a high threshold because the goal is to capture fully built, institutional office models. Imagine another uses a lower bar because the goal is to include emerging setups that still handle some functions through outside advisers.
Both approaches can be reasonable, but they are counting different universes. The higher threshold filters out many borderline cases and leaves a narrower group that is more likely to support dedicated staff, internal processes, and broader control over investments. The lower threshold admits more families whose needs are growing but whose office model may still be partial or thin.
That is why threshold decisions move the total before any researcher starts enumeration. Change the gate, and the market appears to change with it.
Private Structures and Patchy Disclosure Keep the Count Unstable
Even after the definition and threshold choices are settled, the observable universe remains incomplete. Many family offices are professionally managed, but they are still private structures, and private structures do not report themselves in one standard public format. Some sit inside holding companies. Some appear through investment entities. Some barely appear at all unless a transaction, staffing move, or filing makes them visible.
That means the count stays fluid for a practical reason, not a careless one. Researchers often infer the presence of an office from scattered signals rather than from a mandatory registry or a single disclosure rule. Once those limits are clear, the wide spread in published totals looks less like contradiction and more like a difference in counting universes.
03Why Published U.S. Family Office Estimates Range From Roughly 2,000 to 10,000+
The spread looks messy only until the counting rules come into view. Some sources count U.S. single family offices only, some fold in multi-client structures, some model who could afford an office, and some numbers get compared across the wrong geography. Once those choices are set side by side, the published estimate range starts to read less like contradiction and more like scope discipline.
| Counting lens | What gets counted | How it changes the total |
|---|---|---|
| Structure type | Single family offices only, or a broader mix that includes other family offices under looser labels | Broader structure scope pushes the count higher |
| Threshold universe | Observed offices, or wealthy households treated as plausible candidates for an office | Lower viability thresholds expand the possible universe before an office is observed |
| Geography | United States only, North America, or a wider world view | Geography blending makes similar-looking totals incomparable |
Single-Family, Multi-Family, and Hybrid Firms Do Not Belong in the Same Count
This is the first big sorting error. A dedicated office for one family is not the same thing as a firm that serves multiple clients, and it is not the same thing as a lighter hybrid setup that borrows the language of family offices without the same organizational boundaries. Capgemini is useful here because it keeps those buckets separate, with about 3,000 U.S. single family offices and about 150 MFOs. FOX, by contrast, is often read as a wider SFO example with a broad caveat around formal data. Once sources start folding different structures into one headline, the total gets bigger, but the question changes too. You are no longer counting the same kind of institution. That is not a cleaner market picture. It is a broader, less comparable one.
| Structure type | What it means in practice | Counting effect |
|---|---|---|
| Single-family office | A dedicated office serving one family | Produces the narrowest and most comparable count |
| Multi-family office | A firm serving multiple family clients | Raises totals, but answers a different market question |
| Hybrid or broader family office structure | A mixed or lighter setup using an office model without the same clean boundary | Pushes totals higher and weakens comparability |
Family Wealth Thresholds Change Which Households Are Included in Family Office Counts
Higher estimates often begin before any office is actually counted. They start with family wealth and ask how many wealthy households could plausibly support an office, then treat that threshold universe as a rough proxy for future or possible formation. That is how figures can move from the narrower U.S. counts toward the 6,000 to 7,300 range, and in some commentary even above 10,000, including market language seen around firms such as MSD Capital. The key caution is simple: a viability rule is not an observed census of private capital institutions.
The often-cited rule of thumb is around $100 million in investable assets. Used carefully, it helps explain why some estimates expand. Used carelessly, it turns wealth into an office count. A wealthy household may have the means to build an office, but wealth alone does not show whether it has done so or whether it relies on outside advisers instead.
| Threshold approach | Who enters the universe | Safe reading |
|---|---|---|
| Higher threshold | Fewer households with more institutional scale | Better suited to narrower office estimates |
| Lower threshold | More wealthy households with some potential to build an office | Can overstate the count if candidates are treated as existing offices |
| Affordability model around $100 million | A wider candidate pool based on perceived viability | Useful as methodology, not as proof that those offices exist |
Some Sources Count U.S. Offices Only. Others Blend in Global Family Office Data
Geography creates the fastest false comparison. A U.S. estimate can sit numerically close to a North America figure and still describe a different universe. Deloitte's 3,180 count, for example, is for North America, not the United States, while FOX and Capgemini are clearer anchors for a domestic read. Once a global family figure or a world-level benchmark slips into the same conversation, the labels matter more than the headline number.
- Compare U.S.-only figures only with other U.S.-only figures.
- Treat a north america number as a broader regional count, even if it looks close to a domestic total.
- Use a global family estimate as backdrop for the global network of offices, not as evidence of the U.S. count.
- Watch for market language that shifts from U.S. to global head counts without saying so. That is where a clean office comparison becomes muddy across the world.
04Why the Number of U.S. Family Offices Has Kept Rising
The spread in published counts is real, but it sits on top of a market that has also been expanding. Across U.S. family offices, the more useful question is no longer whether the category exists at scale. It is why more families now have enough wealth, enough complexity, and enough long-term governance needs to build an office structure instead of relying on a lighter setup. Even choices that once lived in short term treasury ETFs can become part of a broader institutional picture as wealth compounds and decision-making grows more demanding.
- A rising baseline means current family offices are being counted against a larger market than existed a decade ago.
- New wealth creation expands the addressable market by creating more families that can support dedicated infrastructure.
- Greater portfolio complexity pushes wealth into more formal family offices as oversight needs deepen.
- Intergenerational planning turns private capital into longer-lived institutions rather than one-generation operating setups.
The Family Office Population Has Roughly Doubled, Raising the Baseline for Any Current Count
The cleanest way to read today's market is directionally: the baseline is much larger than it used to be. A cautious description is that the family office population has roughly doubled over the past decade, which matters less as a hard measurement than as an interpretive frame. Put differently, older counts can be right for their moment and still mislead if we read them as a picture of the present. They captured a smaller field, before tremendous growth left more families able to sustain an office structure. That is why an older estimate may still be credible historically while understating the size of today's market.
Family Wealth Creation Is Expanding the Addressable Market
New fortunes expand the market before any counting debate begins. When family wealth is created through exits, recapitalizations, or long periods of business appreciation, more families cross the line where a dedicated office starts to make practical sense. That is especially true when private companies and technology companies produce concentrated wealth quickly, then leave the family with new questions about liquidity, governance, tax coordination, and long-term stewardship. In that setting, the move from wealth to office is not cosmetic. It is a response to the fact that families with larger pools of capital often need a more deliberate way to organize it.
More Complex Asset Allocation Is Pushing Wealth Into Dedicated Office Structures
Wealth alone does not create a family office. Portfolio complexity does. Once asset allocation extends beyond public equities and fixed income into private equity, venture capital, hedge funds, real assets, private credit, and direct investments, the work begins to look less like passive oversight and more like sustained investment activity. Families may also add direct investing, private investments, co-investments, and manager selection across the full investment portfolio. At that point, an investment office becomes easier to justify because coordination, reporting, diligence, and pacing all start to matter at the same time.
- Broader asset allocation creates more moving parts across public and private holdings.
- Private equity, venture capital, and private credit often require longer timelines and closer oversight.
- Direct investments and direct investing add sourcing, diligence, and monitoring work that a lighter setup may not handle well.
- An investment office can centralize decision-making as wealth and portfolio complexity expand together.
Intergenerational Transfers Are Turning Private Capital Into Permanent Institutions
A generational transition often changes the job the capital has to do. What began as the wealth of a founder or an operating family can become a structure meant to serve multiple generations, coordinate family enterprises, and support philanthropic activities with clearer rules and longer time horizons. That is why family offices plan for continuity, governance, and decision rights instead of treating the portfolio as a temporary holding pattern. Some families may keep an ad hoc model, but institutionalization across generations makes a permanent structure more attractive. The count rises in part because private capital increasingly wants to stay organized like an institution. That is the logic behind the next question: what those same forces may imply by 2030.
05What 2030 Projections Suggest About Family Office Growth in the US
The forward view is clearer on direction than on precision. Public outlooks support continued growth through 2030, but the strongest published projections available here are labeled North America or global, and several are SFO-only. That means the safest read is simple: more private capital and higher assets point to a larger future office market, while any exact U.S.-only total would go beyond the evidence.
| Forecast item | Current baseline | 2030 projection | Scope | How to read it |
|---|---|---|---|---|
| Family offices | 3,180 | 4,190 | North America, SFO only | Useful as a regional proxy, not a U.S. count |
| Family offices | 8,030 | 10,720 | Global, SFO only | Shows worldwide expansion, not U.S.-only growth |
| Family office AUM | US$3.1T | US$5.4T | Global | Supports a larger market, not a U.S.-only forecast |
| Family wealth served by family offices | US$5.5T | US$9.5T | Global | Signals broader scale, but not a U.S. office total |
So the real value of a 2030 outlook is not a single headline number. It is directional confidence with labels attached.
Estimated Assets Under Management Point to a Larger Future Family Office Market
AUM is the cleanest forward signal in this set. The published outlook moves global family-office-estimated assets from US$3.1T to US$5.4T by 2030, which suggests that more families may need a thicker operating layer around investing, reporting, tax, and governance. As assets scale, an investment platform often becomes more useful than lighter coordination alone.
That still does not justify a precise U.S. office forecast. The figure is global, and the safest interpretation is narrower: higher assets can support more institutional behavior, more formal decision-making, and in some cases more office formation or expansion. For families managing growing pools of assets, the market signal is less about a single count and more about whether the operating demands start to look permanent.
Forecasts Use Different Assumptions, but Most Still Point to Family Office Growth
Forecasts only seem to conflict when their labels disappear. One forecast lens tracks North America SFO counts, another tracks global SFO counts, and another tracks global AUM. Those are different ways of reading emerging trends in wealth and office formation, so they should not be treated as one interchangeable line.
| Source or lens | 2030 projection | Scope | Safe interpretation |
|---|---|---|---|
| Regional SFO count | 4,190 | North America, SFO only | Growth is projected at the regional level, but this is not a U.S. total |
| Global SFO count | 10,720 | Global, SFO only | The number of family offices is projected to rise materially worldwide |
| Global AUM outlook | US$5.4T | Global | Higher managed assets support a larger and more institutional market |
| Survey sentiment | 73% expect continued growth | Global SFO respondents | The outlook is positive, but sentiment is not a count forecast |
We can still make a firm judgment from that mix. Directional confidence is strong, but forecast lens matters more than the raw number itself.
What a Bigger Market Could Change for Structure, Services, and Competition
Growth matters because it changes the shape of the market, not just its size. If more capital moves into family-office structures, the ecosystem around those structures is likely to deepen first and consolidate later, if at all.
High-probability
As wealth and AUM rise, more families are likely to adopt more institutional operating models.
That can mean broader internal coordination across investment, tax, legal, and reporting functions.
Providers may need deeper expertise rather than general coverage alone.
High-probability
Service demand is likely to widen as the market matures.
Specialized support in legal, tax, investment oversight, reporting, sector focus, and impact investing may become more common.
A bigger market can reward firms that solve narrower problems well.
Plausible
Families below full SFO scale may still want more structure.
That can support more multi-family and outsourced models, especially where a full standalone office is not practical.
The middle of the market may become more segmented.
More speculative
Competition often intensifies as a market grows.
Consolidation among providers or heavier M&A could follow, but the evidence here is weaker than for specialization and service expansion.
That question becomes clearer once we see where family office activity is already concentrated.
A larger market usually gets more specialized before it gets fully consolidated.
06Where U.S. Family Offices Cluster, and Why Those Hubs Keep Winning
Growth shows up unevenly. Family offices tend to concentrate in a limited set of markets because an office rarely chooses geography on prestige alone. It chooses proximity to capital, experienced operators, and the service infrastructure needed to manage complex assets, entities, and family governance. Once a hub builds that depth, the next family often has fewer reasons to start elsewhere.
| Representative hub type | What pulls family offices there |
|---|---|
| Financial centers | Direct access to capital markets, investment talent, and mature advisory ecosystems |
| Wealth-creation corridors | Recent founders' liquidity and concentrated private wealth create demand for an office structure |
| Tax-advantaged destinations | Tax context can make a location operationally attractive when families can also find trusted support nearby |
| Legacy business regions | Longstanding industrial or commercial wealth supports durable local networks and specialist advisors |
The Largest Family Office Hubs Sit Near Capital, Talent, and Service Infrastructure
The clustering logic is practical. The largest family office hubs tend to sit where families can hire investment staff, coordinate legal and tax work, source private deals, and reach specialized providers without rebuilding the wheel. Families may value privacy, but complex wealth still needs dense operating support. That is why concentration usually follows capability before it follows lifestyle.
| Representative hub | Capital advantage | Talent and service infrastructure |
|---|---|---|
| New York | Deep public and private market access | Broad bench of investment professionals, attorneys, accountants, and outsourced office support |
| South Florida | Mobile private capital and relocation appeal | Growing concentration of advisors, estate planners, and peer networks serving wealthy families |
| Silicon Valley and the Bay Area | Founder liquidity and venture proximity | Operators and advisors experienced with concentrated stock, private company wealth, and complex trust planning |
| Texas metros | Energy, private business, and deal flow | Strong regional professionals across tax, legal, and investment functions |
| Chicago | Multi-generational commercial wealth and central market access | Established banking, legal, and accounting depth for a long-running families ecosystem |
Read that table as operating logic, not a league table. A family office hub wins when capital access, specialized talent, and trusted intermediaries already live in the same place. Infrastructure attracts offices, and offices deepen infrastructure.
Regional Concentration Reflects Liquidity Events, Tax Geography, and Networks
Consider South Florida as a worked example.
The region helps explain why geographic concentration persists even when families could technically place an office almost anywhere. It combines incoming wealth, a tax profile many households find attractive, and a fast-thickening network of advisors, investors, and service firms that know how to work with complex family capital.
Start with the liquidity side. When founders, executives, or business owners monetize a company, they often move from a personal balance sheet to a permanent decision-making structure. That shift creates demand for an office that can handle investing, planning, reporting, and governance in one place.
Add tax geography, and the region becomes more compelling. Tax conditions alone do not build durable clusters, but they can make relocation or expansion easier to justify when the wealth involved is already large and mobile. Families still need trust, execution, and local judgment.
Then networks take over. Once enough wealth, advisors, and peer relationships gather in one market, referrals travel faster, service quality improves, and new families face less setup friction. That is how regional concentration compounds. Wealth creates demand, geography sharpens the case, and networks make the cluster stick.
07What the Count Does and Does Not Tell You About Finding Family Offices
A national count is useful. It tells the reader that family offices form a real market with visible scale, uneven disclosure, and meaningful variation in structure. What it cannot do is turn that market into a ready list of reachable family offices.
Scenario: A reader uses the count to judge whether the space is large enough to matter.
What Changes: That is a sound use. The number frames market size, possible opportunity, and where deeper research may be justified.
Scenario: A reader uses the count as if it were a map of identifiable targets.
What Changes: That is where the logic breaks. Many family offices stay private, vary by mandate, and cannot be inferred from a headline total alone.
In short, the count helps answer whether the market exists at meaningful scale. It does not answer whom to approach.
Family Office Insights Can Signal Market Opportunity, but They Are Not a Directory
The practical mistake is simple: treating family office insights as if they identify reachable firms. They do not.
Access Depends More on Relationships and Fit Than on Market Size Alone
A larger market does not create easier access. In practice, a relationship-driven market filters through trust, relevance, and verification long before raw scale matters. For anyone evaluating investment opportunities, that means the real question is not how many offices exist, but which ones match the mandate, timing, and standards of the opportunity in front of them.
- Relationship channels matter because introductions, existing networks, and trusted intermediaries shape who even gets considered in a relationship driven environment.
- Mandate fit matters because an office may be real, sophisticated, and still irrelevant if its preferences, risk posture, or time horizon do not match the opportunity.
- Service alignment matters because due diligence often starts with whether the approach, reporting, and communication style fit the office's expectations.
- Deal flow is filtered, not evenly distributed, so visible market size does not translate into equal access to attention.
- Deal Activity Follows the Same Logic: relevance and credibility usually matter more than how large the overall universe appears.
Why U.S. Counts Should Not Be Read Through Asia-Pacific or Global Comparisons
Cross-region comparison gets slippery fast. A U.S. estimate only stays useful if it is read on its own terms, rather than through Asia Pacific or broader global totals built from different definitions, visibility standards, or inclusion rules. Once the scope shifts, the comparison can sound precise while actually mixing unlike categories. The disciplined move is to match scope before drawing any conclusion. That is the final rule of the count.
Keep your ledger. Rent the rest.
The tools will keep changing; your book of record should not. Get a clear view of what to own and what to outsource before the next wave of consolidation reaches your stack.
Future-proof your stack →The coming shake-out in family-office software
The category has never been more crowded. Consolidation is coming — and the firms that survive will be… Knowledge & Decision · Outlook
Is a Multi-Family Office Right for Your Family? Compare Fit, Fees and Services
Compare multi-family office fit, services, fees and family responsibilities with an illustrative quote worksheet and provider-check questions. Knowledge & Decision · Outlook